This post is a partial replication of a workshop I recently led at the Music Library Association Annual Meeting in Cincinnati, Ohio. The data and slides can be downloaded at http://bit.ly/musiclib2016. The slides had originally been created as a reveal.js presentation, which is available here.
Although I haven’t yet had a chance to apply a spatial approach to my own research, I get asked to teach digital maps more than any other digital humanities technique. I’m not quite sure why, but it may have to do with librarians and academic faculty wanting to explore a geographic aspect of their sources in a more purposeful and deliberate fashion. As many researchers have remarked, reading and noting location information is one thing; plotting it on a map may lead to perceptions and insights that were hitherto only intuited, or entirely hidden. Although not quite as straightforward as word clouds, maps may offer a kind of gateway experience to more complex forms of digital or computational analysis. Plus, maps have a lot of appeal to humanities professors wanting to integrate a visual component to their course assignments.
I’ve certainly had fun exploring the PostGIS and PostgreSQL functionality of CartoDB as a way of transforming and filtering datasets. I’ve gathered my knowledge from the CartoDB tutorials (see under Other Resources) and various other professionals. If you have any questions or remarks on this material, please do leave me a comment below.
One of the questions I received during the workshop had to do with my software choice. When choosing a mapping tool, the decision really must rest on what one hopes to accomplish. I chose to use CartoDB for most of the workshop because it offers a very generous free plan; one only needs to provide an e-mail address to get started. The visualization wizard provides a nice assortment of options for customization, including pop-up windows in which one can include text and images. The Torque visualization is fantastic for animations (as is Heatmap) if one’s dataset includes a date column. And it is super easy to share and embed CartoDB maps. The one drawback I can think of is that CartoDB does not currently support raster data, which is to say that one could not import a scan of a historic map or schematic plan. For such uses, one might look instead to MapWarper, QGIS, or even Palladio. Incidentally, I mention Palladio under Timelines below, but it is another great, free mapping tool. One thing that is easier to accomplish in Palladio than in CartoDB is the point-to-point visualization, if one’s data include a start and end location (e.g. place of birth and place of death).
Motivations for Using Spatial and Temporal Approaches in the Humanities
Identifying Patterns
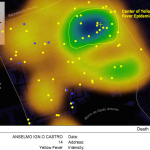 Modern geospatial approaches owe a lot to the field of epidemiology, which has used maps as a way to detect patterns in the way that disease spreads. This example shows the Yellow Fever Epidemic of 1850. Historians at Stanford created it as a way to explore the lived experience of disease and death. They note that “different temporal aggregations of data can shift interpretations of the spatial pattern of epidemics.”
Charting a Travel Narrative
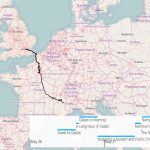 UVA student Kurt Jensen visualizes the travels of Yorick in Laurence Sterne’s A Sentimental Journey Through France and Italy. In doing so, he explores the tensions between narrative and chronological time.
Exploring Relationships
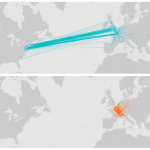 The Franklin case study of Mapping the Republic of Letters compares Benjamin Franklin’s correspondence network to that of Voltaire. Using this view of the data, one could make the argument that Franklin was the more cosmopolitan of the two. This finding would likely be rigorously disputed by an Enlightenment scholar.
Modeling Changes Through Time
Ben Schmidt makes several interesting observations about his work mapping the paths taken by American ships in 1800-1860. This visualization collapses the data into a single year to show the seasonal migration of ships in the Pacific Ocean.
Exploring Content
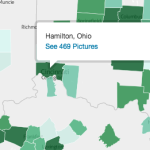 Maps and timelines can lead to new insights about your collections, but they are also a great way of allowing users to explore content. The Yale Photogrammar provides an interactive map interface and scrubber bar for exploring thousands of photographs by geography, time period, and creator. See the Labs section for more facets.
Data Formatting
Part I
| Description | City | Country |
|---|---|---|
| Mozart family starts tour | Salzburg | Austria |
| They arrive in Munich | Munich | Germany |
| Then they go to Mannheim | Mannheim | Germany |
Use a header row to describe your data; avoid special characters, spaces and numbers here. Place individual locations on rows underneath the header; 1 row = 1 location. Store each address element in its own cell.
Part II
| Street | City | State | Zip | Time |
|---|---|---|---|---|
| 35 W Fifth St | Cincinnati | OH | 45202 | 2016-03-05T13:40:00z |
Store address elements and dates as text fields so that your spreadsheet application does not autoformat them and introduce errors. Use a machine readable format for dates and times, i.e. ISO 8601.
Part III
| old_city | old_country | new_city | new_country |
|---|---|---|---|
| Königsberg | Prussia | Kaliningrad | Russia |
Geocoding services need contemporary geopolitical information to work well. If you’re working with historical data, add some columns to record where the location is currently.
Part IV
| Description | City | District | Country | Certainty |
|---|---|---|---|---|
| Beethoven was somewhere around here. | Karlsbad | Karlsruhe | Germany | medium |
If you’re dealing with uncertainty in your data, record it as a separate element.
Part V
Lastly, it’s recommended to assign a unique identifier to each location, particularly if it is important to know the order in which you entered your data. Many mapping applications automatically assign a unique ID to records, but sorting will destroy any original order.
Exercises
Create a free CartoDB account at cartodb.com/signup and log in. Take a few minutes to explore the interface. See: Dashboard, Datasets, Maps.
About our Data
We will explore a dataset prepared by Michelle Oswell of the Curtis Institute on Breitkopf & Härtel’s Concert Program Exchange, or Konzertprogramm Austausch. B&H began the series in 1893 “as a means to promote current awareness of concert repertories via the circulation of printed concert programmes.” Subscribing organizations sent their programs to B&H for distribution in the series. See Michelle’s ATMLA presentation for more background on her project.
Adding Data
In the materials downloaded to your desktop, there is a data folder with three datasets. We will add austausch.csv to CartoDB by going to the Datasets window of the Dashboard.
Note: by your user name in the upper left corner, you should see either Maps or Datasets with a down arrow next to it. If it says Maps, click the down arrow and navigate to Your datasets.
Click on New Dataset, where you should see a Data file option (default). Click BROWSE and choose austausch.csv. Click Connect Dataset.
CartoDB should do a good job of “guessing” your data type (point). In the Data View of your dataset, hopefully you’ll see a new column called the_geom with coordinate data. CartoDB will automatically geocode physical locations for you, which is to say it will assign latitude and longitude coordinates, so long as you supply clean address data. Geocoding of administrative regions (city, state, country) is free; geocoding street addresses is capped at 100 per month in the free plan.
Let’s add a second dataset. Return to the Datasets window of your dashboard. Click the little crooked arrow in the upper left side of your screen (next to the title of the dataset) to get back there. Now click New Dataset. Press BROWSE and find the dataset called vg2500_geo84.zip in the data folder.1 Click Connect Dataset. This zipped file actually contains five files. We are only interested in the one called vg2500_bld. This stands for Bundesländer, or state. You can delete the others if you want to keep your dataset area clean.
Data Wrangling
Returning now to the Austausch data you uploaded, let’s assume that CartoDB doesn’t assign latitude and longitude coordinates to your physical addresses, or it skips a few rows (this will probably happen). If the_geom is empty, or if a few cells in this column have null values, go to Edit > Georeference. Navigate to the City Names option; enter citymodern as the city, and country as the country (skip Admin Region), and click CONTINUE. Then click “Georeference your data with points.”
Here’s something odd. Munich appears a lot in our dataset, but in the map view you’ll probably see that there’s no dot over Munich. This is a peculiar GeoNames geocoding error. Here’s a global fix. Go to the SQL window, paste in this command, and click Apply query.
UPDATE austausch
SET the_geom = CDB_LatLng(48.1333,11.5667)
WHERE citymodern ILIKE '%Munich%'
Let’s turn now to the Bundesländer polygons, called vg2500_bld. Return to the datasets window and click on it to open the data view. We’re going to add a column to this dataset in which we will include values for the total number of subscribers by German state. Click on the little icon on the bottom right of your screen (it will say ‘add column’ when you hover over it with your cursor) and add a new column. Rename it subs_per_state. Change the data type from string to number.
PostGIS Functions
Now we are going to count the number of subscribers by German state using the ST_Intersects function. This command is updating vg2500_bld, setting the subs_per_state column to equal a total (*) count of all the subscribers that intersect with each state. ST_Intersects is the PostGIS function for spatial joining. More information on other PostGIS functions can be found here.
UPDATE vg2500_bld
    SET subs_per_state = (
    SELECT COUNT(*)
    FROM austausch
    WHERE ST_Intersects(the_geom, vg2500_bld.the_geom)
    )
Next, let’s draw some lines in between our Breitkopf & Härtel subscribers to get an idea of the subscription network. It may be useful to collect our points by issue first. This would help if we wanted to visualize the subscribers of individual issues of the Exchange Concert Programs (as opposed to all of them at once). We’ll use a PostGIS function called ST_Collect. Click on the SQL window, paste in this command, and click Apply query
SELECT ST_Collect (the_geom) AS the_geom, issues
FROM austausch
GROUP BY issues
Next, we’ll draw those lines. Click on the SQL window, paste in this command, and click Apply query. CartoDB gives you the option to “create dataset from query.” Click on this option so that the lines can be added as an optional data layer to your map visualization. Change the title of this dataset to austausch_subscribers
SELECT ST_MakeLine (the_geom ORDER BY time ASC) AS the_geom, issues
FROM austausch
GROUP BY issues
If you’re not sick of PostGIS yet, then here’s one more thing you can try. Let’s say we want to draw a radius around the old Breitkopf & Härtel headquarters in Leipzig so it stands out on our map visualization. Go back to your dataset window. Click New Dataset, then Create empty dataset. Call it bnh. Double click on the cell under the_geom to enter a coordinate pair. Enter longitude 12.3833; latitude 51.3333.
Now click on the SQL window and run this command. This will draw a 50 mile radius around Leipzig that we can then add as a data layer to our map visualization in order to draw attention to this location. We’re converting from the default meters to miles by multiplying 50 times 1609 (1609 meters ≈ 1 mile).
SELECT
    ST_Transform(
      ST_Buffer(
        the_geom::geography,
        50*1609
        )::geometry,
      3857
      ) AS the_geom_webmercator,
    cartodb_id
    FROM
    bnh
The ST_Buffer function creates a polygon or shape. Click on “create dataset from query.” You’ll see that the resulting dataset has two columns: cartodb_id and the_geom. Click on the icon on the lower right of your screen (add column). Rename this column name. Double click on the cell underneath it and enter the value: Breitkopf und Härtel. This allows you to use this text as a label in your map visualization.
Visualization
Now we’ll put together some of these data layers we’ve created into a shareable, interactive map visualization. Go back to your dataset window by clicking on the bent arrow on the upper left of your screen. Go back to the austausch dataset and double click on it to open the data view. Scroll over to the time column and make sure that CartoDB has assigned a data type of ‘date’ to it.
Now navigate to the map view of austausch. You’ll see CartoDB’s default SIMPLE visualization with the orange dots. Open the tool bar on the right hand of your screen by clicking on the paint brush icon (visualization wizard). Next try the CLUSTER visualization. Experiment with the buckets, the fill color, the transparency value (note: 1 is perfectly opaque, 0.5 is 50% transparent), the marker stroke (white line around the dots), and every and anything else that strikes your fancy.
In other words, press all the buttons. You can’t hurt anything.
Another CartoDB visualization that is open to us with this dataset is TORQUE. Torque is for time series data. Set the time column to time (date works too). It may not make much sense for this dataset, but note that you can make the torque visualization cumulative, meaning that the dots fade very slowly so that a cumulative impact over time may be observed.
Yet one more thing to try – HEATMAP – to see all the hotbeds of B&H subscriber activity. Notice that you can animate your heatmap by the time or date column.
Settle on one of these visualization options for austausch, and then click on the button VISUALIZE in the upper right corner. Then click: OK, CREATE MAP.
Next, click on the infowindow panel (the icon looks like a cartoon bubble). You can only have infowindows in the SIMPLE, CHOROPLETH and CATEGORY visualizations, so if you didn’t happen to choose one of those, skip to the next slide. Let’s turn on some column names in your infowindows. I suggest creating a hover event for cityhistorical. Then maybe create a click event for concert_title and venues. Note: you can always switch to Data View to inspect the column headers and determine which you want to display in the infowindow. To reorder your fields in the infowindows, just click and drag them.
In the toolbar on the righthand side of your screen, click on the plus (+) button at the top to add another data layer. Add the German states layer, vg2500_bld, that we tinkered with earlier. Reorder your layers so that points (austausch) are uppermost and the polygons or shapes (vg2500_bld) are on the bottom. You can do this by clicking and dragging on the layers in that right-hand toolbar.
When you add the German states layer, CartoDB may default to the CHOROPLETH visualization. But if not, open the visualization wizard while in the vg2500_bld layer and select CHOROPLETH. Now we can use that subs_per_state column we added earlier during the data transformations. Feel free to change the color ramp, quantification, buckets, and anything else. You can also add a label text to the states by selecting the gen column. But it might also make your map a bit cluttered. Now we can see where the highest concentration of subscribers are located.
Now might be a good time to mention ColorBrewer, which is a great resource for selecting colors for map visualizations.
If you have the layers to add from the earlier data transformation exercises, try adding either the lines connecting the subscriber locations, or the buffer around Leipzig (Breitkopf & Härtel). I’d recommend stacking the data layers in this order, from top to bottom, for best legibility: austausch (points), bnh (polygon), austausch_subscribers (lines), and vg2500_bld (polygons). Note that using all four data layers at once may produce an overly dense visualization, but if you can finesse the colors, transparency and overlays, it just might be possible.
Let’s take a moment to debrief. What have you noticed about this Breitkopf & Härtel Concert Program Exchange dataset through the process of working with it? Are there any patterns or trends you’ve observed? Interesting characteristics? Is there anything missing that you thought would be there? Does it raise any additional questions? Technical questions?
Publishing and Sharing your Map
In the upper left hand corner below the title, select ‘Edit Metadata’ to add a Description and Tags to your map to make it more easily discoverable.
On the Options button on the bottom left hand corner, configure which elements will be on your final shared map. I recommend: Title, Description, Search Box, Share Options and Layer Selector.
Finally, in the upper right hand corner, select Publish to get a public URL for your map. You can share your map using that public URL, or by embedding the map on a website or blog using the Embed iframe and pasting it into your website.
Timelines
I want to show briefly some of the features of a different tool developed by the Stanford Humanities + Design Lab: Palladio. Although it doesn’t have the PostGIS and PostgreSQL capabilities of CartoDB, Palladio has a map tool that supports all kinds of visualizations (see Miriam Posner’s tutorial for the details). I particularly like the Timeline and Timespan panels.
Let’s give Palladio a whirl with the Repertory Report from the Metropolitan Opera’s MetOpera Database. What we’ll see won’t be substantively different from what FiveThirtyEight and Suby Raman have already shown: the Met isn’t too adventurous with its programming.
Go to Palladio and click Start. Drag the dataset called met-operas-clean-geo.tsv into Palladio’s text window and click Load. You’ll probably see a red dot or two next to some of the metadata fields. Palladio wants to verify that any special characters were in fact intended, so click on the red dot to review them. Then click Done. Make sure that Palladio has understood that first_performance and last_performance are dates.
Click on the Map visualization in Palladio’s upper navigation menu. Click New Layer. Select Map Type: Points (default) and then for Places, select the lat_long column. Set your Tooltip layer to work. Check the box next to ‘Size points,’ and size them according to ‘Number of untitled’ (total number of works in the Metropolitan’s repertory = 330). Click Add layer. This is a truly dull dataset in terms of geography, since we’ve only got one venue, but next open the Timespan panel on the bottom of your screen.
Timespan is a great feature for exploring datasets with two dates, e.g. birth and death dates, start and end dates for tours, etc. In the Timespan panel, go to Layout and select Parallel. Make sure that Start date is using the first_performance column and End date is using last_performance. Set the label to be work. We don’t really need a grouping key with this dataset, but set Group to venue (wouldn’t it be cool to have this repertory data for more than one theatre?).
Parallel lines in the Timespan visualization will mean that the opera had its first and last performance in relatively close chronological succession. Deep diagonal lines indicate that the first and last performances are far apart, which likely means the work is an old chestnut. Hover over the lines with your cursor to see the work titles.
Click on the Timeline button to open a Timeline panel. Set Dates to first_performance, Height to ‘Number of Untitled’ (number of repertory works), and Group by work.
This timeline gives us another view into the same phenomenon: the bulk of new operas were premiered before 1940. It may however be a bit easier in Timeline (as opposed to Timespan) to hover over the bars and see the work titles. You may discover that some of the post-WWII first performances were not exactly new works (e.g. Verdi’s I Vespri Siciliani and Händel’s Rodelinda). Here’s the Repertory Report again for easy comparison.
Other Resources
Other Free (or Free-ish) Mapping Tools
Other Free Timeline Applications
- SIMILE Timeline
- TimelineJS
- NeatlineSimile, if you’re using Omeka as your digital publishing platform
Self-Guided Learning
CartoDB has the Map Academy and a separate tutorials section, both of which are excellent resources for learning about GIS.
1 Dataset by Joerg Moosmeier of Esri Deutschland Gmbh. http://www.arcgis.com/home/item.html?id=ae25571c60d94ce5b7fcbf74e27c00e0
Comments