This laboratory is intended for the students enrolled in Dr. Andrea Baldi’s Italian 368 course, Walking in the Metropolis. We will work with a data set of the locations mentioned twice or more in Henry James’s The Portrait of a Lady.1 The plan is to geocode these locations, which is to say we’ll assign longitude and latitude coordinates for each. With the added geospatial data, visualizing those locations in Google My Maps becomes relatively easy. Finally, we’ll embed our custom digital maps into a Google Site, where we can integrate text, images, maps, and most other forms of digital content, into a final digital project that you could submit for a grade.
Needed for this lab
- Your favorite browser
- A Google account (Gmail or Scarlet Mail is fine)
- The portrait-of-a-lady-locations.csv data set
Getting started
Download the portrait-of-a-lady-locations.csv file to your desktop by right clicking, and selecting “Save link as…” Open it up in Excel and have a look at the data headers. This data was prepared with some computational assistance, which hugely simplified the process but did result in a few errors and literals that look odd out of context. As an example, Henrietta Stackpole mentions that she is very eager to visit the new Republic, by which she means France’s Third Republic. It is perhaps obvious that “Republic” (line 42) does not correspond to any distinctive current day geographical or political reality. The geocoding service we’ll use won’t recognize it, so in the adjacent columns, this information was modernized and clarified. Under original-location, I left what was authentic to the text because we can reuse it in our marker labels. Lastly, because this is a work of fiction, there are some locations, specifically names of private homes, that are not easily mappable. For instance, we know that Gardencourt is Mr. and Mrs. Touchett’s home in England, but unless I am mistaken, we can’t be much more specific than that. Again, the geocoding service won’t recognize it, but it’s okay. Gardencourt is important to the plot, but we can make do without it, at least for the purposes of this exercise. This is one example of the complexities of working with literary data.
Next steps
- Log into either your Scarlet Mail or Gmail account and navigate over to Google Drive.
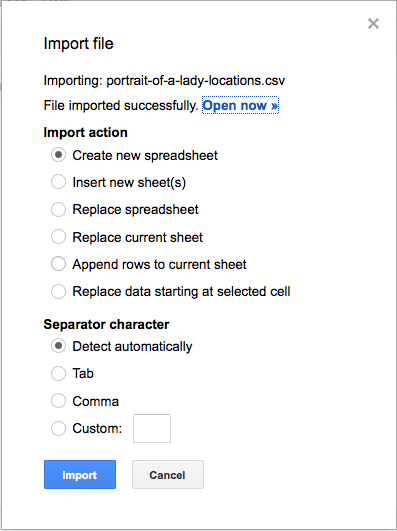
- We need to create a Google Spreadsheet in order to reuse a bit of code (specifically, a Google Apps Script) that will geocode our addresses for us.2 Click New, and select Google Sheets. In the untitled spreadsheet, go to File > Import > Upload and select the .csv file that you copied to your desktop. Click Import, then Open now.
- Next, we want to add that geocoding script to our Google spreadsheet. Copy this source code by clicking Ctrl+A (Command+A on a Mac) to select all, and Ctrl+C (Command+C) to copy. In your Google spreadsheet, go to Tools > Script editor [Note added 2015/11/07: this script no longer appears to work. Use instead this fork shared by Leigh Hunt, which adds the Google Maps API]. Close the pop-up window that appears. You should see a Code.gs window. Delete that default text
function myFunction() { } - … and paste in the copied code. Go to File > Save. It will prompt you for a script name. You can use james-geo or whatever pleases you.
- Go back to your Google spreadsheet and reload it in the browser. A menu called Geo should appear to the right of Help.
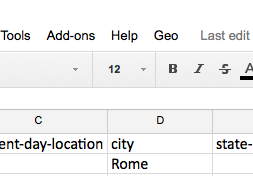
- Now we need to tell the script where our physical addresses are. Highlight all the columns and rows with the modernized location information. This should be columns C through F (current-day-location through country) and rows 2-60. Don’t worry about empty cells. With this area highlighted, go to Geo > Geocode addresses. The script will require authorization to run, and it will need to be granted access to your Google Drive. Note: make sure that pop-ups are not blocked in your browser. Next, the script will want you to select a geocoding service. I tend to use the default Mapquest API because it doesn’t require an API key. Click Geocode.
- Once the geocoding is done, you’ll notice that a few rows were skipped. It’s really quite understandable that the Mapquest API had no idea what we meant by the rows in question, but by now you should have a workable list of locations with lat-lon pairs to import into Google My Maps.
Making a digital map
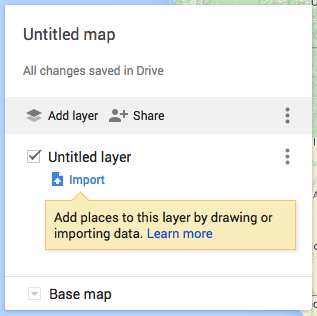
- Over in Google My Maps, select Create a new map. Click on Import under Untitled layer in the left sidebar.
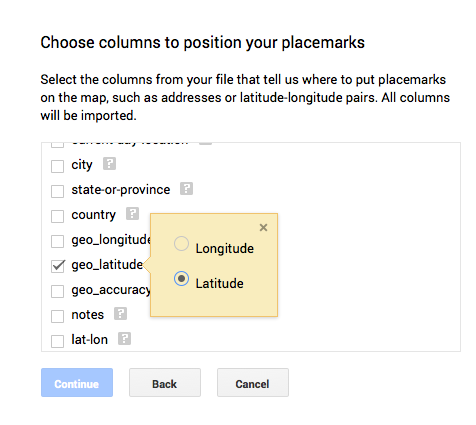
- Instead of uploading a data set, navigate over to the Google Drive view and select the Google spreadsheet with the newly geocoded data. Again make sure that you have pop-ups enabled in your browser. In the first menu, Google My Maps will ask you to tell it where your latitude and longitude coordinates are. Pair the geo-latitude column header with latitude; geo-longitude with longitude. Click continue.
- Next, Google My Maps will prompt you for a marker title. Let’s select original-location, and click Finish.
- Troubleshooting: the Mapquest API should work pretty well on this data set, but it does occasionally produce errors that become obvious in the map visualization. If this happens to you with your own data, a quick way to manually fix the latitude and longitude coordinates is to use regular Google Maps. When you search for a physical address in Google Maps, the lat-lon pair appears in the URL of the resulting map after the @ sign:
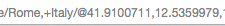 When you retrieve the (likely) correct lat-lon pair from Google Maps, you can return to your Google spreadsheet and make the corrections manually.
 - Google My Maps gives you nine base maps to experiment with. Click on the downward arrow to the left of Base maps and choose one that suits you.
-
When Google My Maps loads your data layer, the default view is Uniform style. Let’s instead style by data column. Click on the paint roller icon, and experiment with the options under Group places by > Style by data column, and Set labels. Here’s an example of a clickable, zoomable map visualization of the data. The darker the pin, the higher the frequency count of the location. I am sure you can come up with many others.
- This step is important for sharing your custom map with others on the web. Click on Share in the left sidebar. Give a name and description to your map (this can be changed later). Change the access from Private (default) to Public on the web. Then click Done. Finally, click on the vertical three dots to the right of Share. Select Embed on my site, copy (Ctrl+C) the embed code and click Ok.
Creating your digital project
- Let’s navigate over to Google Sites. Click on Create. Leave Blank template selected, and give a unique name to your site. This can be changed later, so for now you might choose your first name + Mapping Demo.
- Click on Select a theme, and choose one that you like. Then, click Create again to launch the new site.
- Click on the Edit icon to edit your site (it looks like a pencil), and change the title of the home page to something more descriptive, like The Portrait of a Lady Project.
- While still in Edit mode, place the cursor in an area of the site where you want to embed your map. Embedding your custom map will require opening the HTML editor in Google Sites. It appears as a tiny menu option with the letters HTML in between angle brackets (<>) on the right side of the horizontal navigation bar.
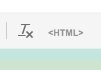 This is where you want to paste the embed code that you copied from Google My Maps. Paste it in, click update in the HTML editor, and then click Save to save your work on the site.
 - Experiment with adding some text to your site, either above or below your map. For now, some lorem ipsum filler text will do.
-
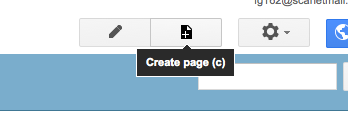
Click on the New page icon, and create another web page called Bibliography.
- One last step, which is a repetition of what we did in Google My Maps: you need to make your site publicly viewable, or at the very least viewable by the Rutgers Community. Click on Share in the upper right hand corner. Change access from Private to Public on the web. Then go back to your site and share the URL with as many people as you like!
Coda
There is one data point that Google My Maps doesn’t allow us to visualize very well, and that is the frequency count. This is the number of times that the location appears in the text of The Portrait of a Lady, which is a loose measure of its significance to the plot. Although we won’t have time to go into this today, I want to show you one other tool that does allow us to scale our points by frequency-count: Palladio. Palladio is a browser-based visualization tool that was developed by the Stanford Humanities + Design Lab.3
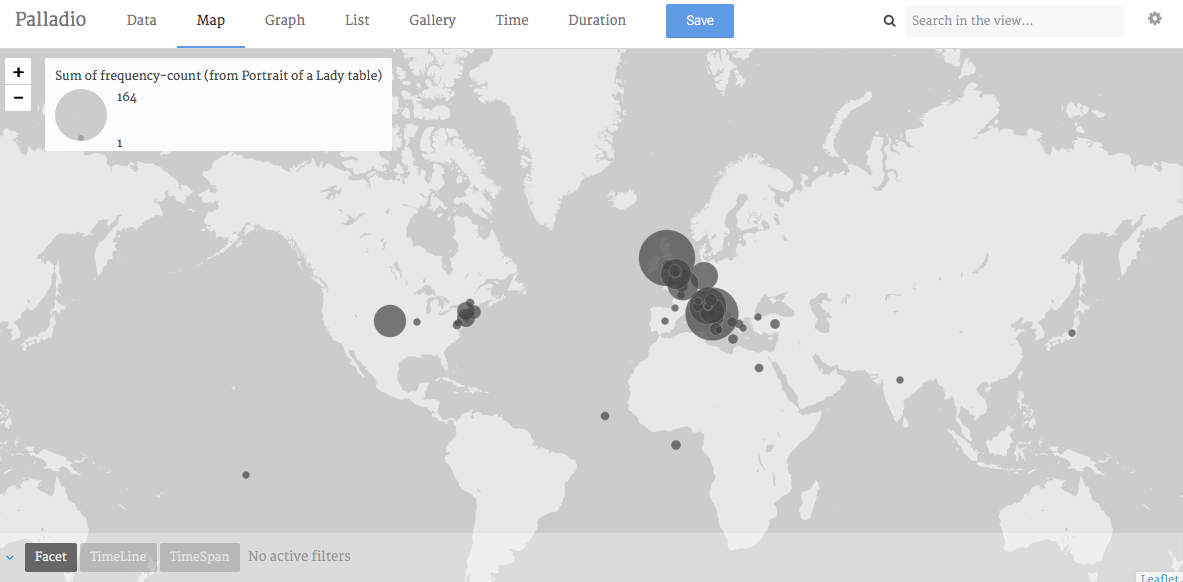
In this visualization, you can see that England and Rome appear most often in the text, with approximately the same frequency, which makes good sense when you know the novel. James’s text also makes frequent reference to other locations throughout Continental Europe, the U.K., and the Northeastern Seaboard of the United States.
There is one piece of information I want to mention if you decide to give Palladio a go. You will need to rearrange the geographic coordinate data into one column as latitude, longitude. So for example, the coordinates for Rome would appear in a cell as follows:
41.9100711, 12.5359979
This can be easily accomplished with the JOIN function in Google spreadsheets or CONCATINATE in Excel.
1. To prepare this data set, I used the plain text version of Project Gutenberg’s ebook of The Portrait of a Lady, vols. 1 and 2. I then used the Stanford Named Entity Recognizer to tag all the locations in the text. Finally, I moved all the locations into a separate text document, counted them and sorted them in reverse order by frequency. Lest you think I’m some kind of computational genius, I followed the instructions pretty closely in William J. Turkel’s excellent blog post, Named Entity Recognition with Command Line Tools in Linux.
2. Many thanks to Young Hahn for sharing his Google Apps script.
3. For more information on how to make the most of Palladio, watch this video tutorial.
Comments